Semaine 202513 - Acute Respiratory Infection (ARI) - Low activity in general practice
Lundi 24 mars 2025 ARI are caused by a variety of respiratory viruses including SARS-CoV-2 (Covid-19), influenza viruses, and other respiratory viruses such as RSV, rhinovirus, and metapneumovirus. The purpose of ARI surveillance is to monitor outbreaks of these viruses.
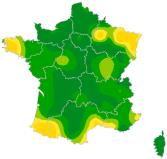
In mainland France, last week (2025w13), the incidence rate of acute respiratory infection (ARI) cases consulting in general practice was estimated at 122 cases per 100,000 population (95% CI [107; 137]) (data source: Sentinelles).
Subject to future data consolidation, this rate is slightly decreasing compared to the previous week (consolidated data for 2025w12: 142 [128; 156]).
At the regional level, the highest incidence rates were noted in: Grand Est (277 [198; 356]), Bretagne (190 [12; 258]) and Provence-Alpes-Côte d'Azur (175 [79; 272]).
Influenza: the incidence rate of influenza cases seen in general practice for an ARI was estimated at 5 cases per 100,000 population (95% CI [0; 9]). Subject to future data consolidation, this rate is decreasing compared to the previous week (consolidated data for 2025w12: 38 [28; 47]) (data sources: Sentinelles, SOS Médecins, DUMG Rouen and DERMG Côte d'Azur).
RSV infection: the incidence rate of RSV infection cases seen in general practice for an ARI was estimated at 8 cases per 100,000 population (95% CI [3; 13]). Subject to future data consolidation, this rate is stable compared to the previous week (consolidated data for 2025w12: 2 [0; 4]) (data sources: Sentinelles, SOS Médecins, Rouen and Côte d'Azur Universities).
Covid-19: the incidence rate of Covid-19 cases seen in general practice for acute respiratory infection was estimated at 5 cases per 100,000 population (95% CI [3; 8]). Subject to future data consolidation, this rate is stable compared to the previous week (consolidated data for 2025w12: 6 [4; 8]) (data source: Sentinelles).
Semaine 202513 - Acute diarrhea - Moderate activity in general practice
Lundi 24 mars 2025 The purpose of acute diarrhea surveillance is to monitor gastroenteritis outbreaks.
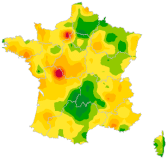
In mainland France, last week (2025w13), the incidence rate of acute diarrhea cases seen in general practice was estimated at 108 cases per 100,000 population (95% CI [94; 123]).
Subject to future data consolidation, this rate is stable compared to the previous week and corresponds to a similar activity level compared to those usually observed at this time of the year (consolidated data for 2025w12: 105 [94; 116]).
At the regional level, the highest incidence rates were noted in: Bretagne (163 [99; 228]), Normandie (157 [36; 279]) and Provence-Alpes-Côte d'Azur (148 [55; 242]).
Data source: Sentinelles
Semaine 202513 - Chickenpox - Low activity in general practice
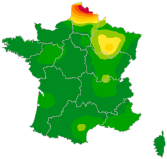
Lundi 24 mars 2025 In mainland France, last week (2025w13), the incidence rate of Chickenpox cases seen in general practice was estimated at 10 cases per 100,000 population (95% CI [6; 14]).
 Subject to future data consolidation, this rate is stable compared to the previous weeks and corresponds to a lower activity level than those usually observed at this time of the year (consolidated data for 2025w12: 6 [3; 9]).
At the regional level, the highest incidence rates were noted in: Hauts-de-France (53 [17; 88]), Provence-Alpes-Côte d'Azur (11 [0; 36]) and Grand Est (10 [0; 25]).
Data source: Sentinelles

 Sentiweb Weekly Report 202513